Maintenance
Part of Business development ops: the parts worth your attention
Business development ops case study: the questions that matter
Business development traced end to end in one invented case: a close rate that fell, three plausible explanations, and the definition change that caused it.
One case, worked through. It is invented, the numbers in it are placeholders, and no organization is being described. The point is the trace, not the story.
What makes it worth following is that the first three explanations offered were all reasonable, all supported by something, and all wrong. That is the ordinary condition of an operational investigation, and the method for getting past it is the useful part.
What to take away
- A metric that moves has a definition, a population, and a process behind it. Check them in that order, because a definition change explains more sudden movements than anything else and costs nothing to rule out.
- The explanation offered first is usually the one that assigns the cause to people. It survives because it cannot be checked quickly, not because it is likely.
- Before accepting a cause, say what else you would expect to see if it were true, then go and look for that. A cause that predicts only the thing you already noticed is not yet a cause.
The symptom
A team reported that their close rate had dropped from about one in four to about one in seven over two quarters. Pipeline value was up. Activity counts were flat. Nobody had left.
The number was real in the sense that the report was computed correctly. That is worth separating from whether the number meant what everyone assumed.
The three explanations offered
The market got harder. Supported by the observation that deals were taking longer and that two competitors had become more visible. Unfalsifiable as stated, which is what made it comfortable.
The new hires are not ramped. Supported by four people having joined in the period. Also, quietly, the explanation everyone preferred, because it required no change to anything and would resolve itself.
Lead quality dropped. Supported by the pipeline having grown while closures did not, which is exactly what a flood of weak leads would produce.
Each of these had evidence. None of them had been tested against anything that would have distinguished it from the others.
The trace
Most of the movement turned out to be definitional. The whole trace finished in about a day.
Was the number computed the same way in both periods?
How much of the drop does that account for?
Was the remaining drop concentrated anywhere?
Does that hold up as a cause?
The shape here is ordinary. A composite number moved because the mix underneath it moved, and everyone reached for an explanation about performance. This is common enough to have a name, and the general form of it is set out in Simpson's paradox.
Your close rate did not fall because of a stage rename, and if you go looking for that specifically you will find it whether or not it is there.
What the trace looked like on paper
The whole investigation fitted in one table. That is not a simplification for this page; keeping it small is what made it possible to finish in a day.
| Step | Question | Result in this case |
|---|---|---|
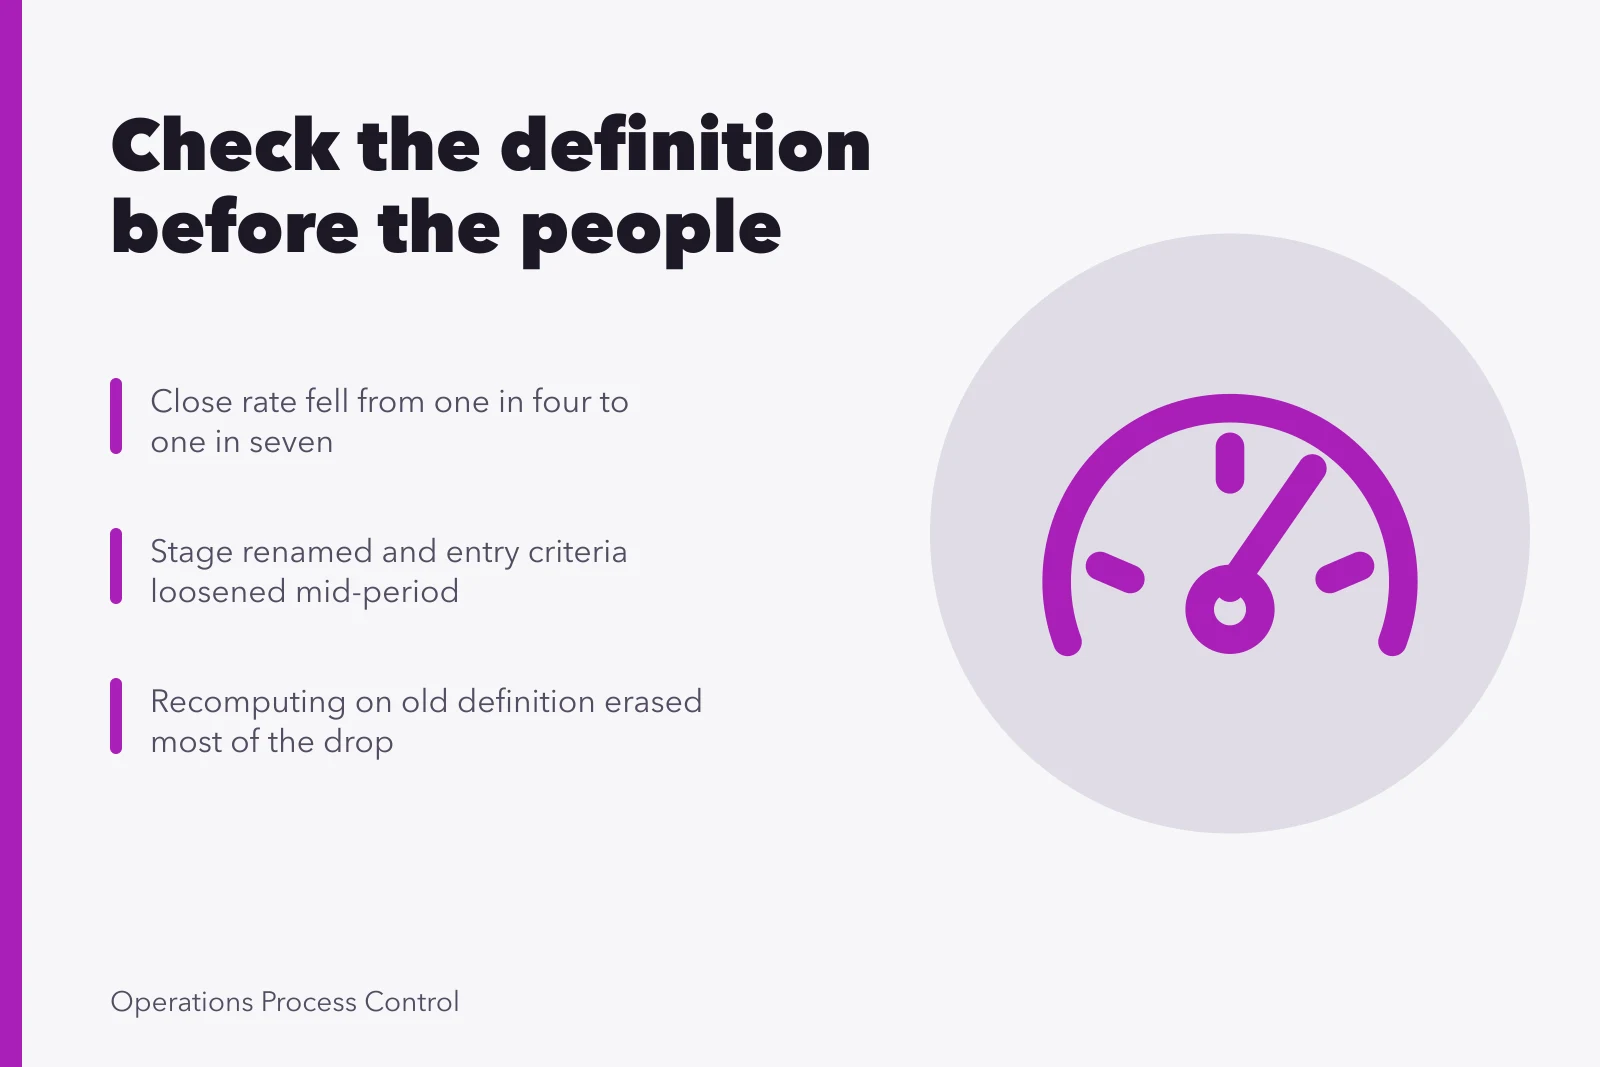
| 1. Definition | Was the number computed the same way in both periods? | The stage was renamed and its entry criteria loosened mid-period, so the denominator grew. |
| 2. Size | How much of the drop does that account for? | Recomputed on the older criteria, one in four becomes one in five, not one in seven. |
| 3. Population | Was the remaining drop concentrated anywhere? | One channel grew from a tenth of entries to a third and closed at 9 percent against 18 percent. |
| 4. Test | Does that hold up as a cause? | A weaker channel should lower the total while each channel's own rate stays flat. That is what happened. |
| 5. Action | What changes follow, and how will they be judged? | The stage definition was pinned and dated, the channel was reported separately, the reorg was dropped. |
| 6. Residual | What is left unexplained? | A remainder, reported as a remainder rather than closed. |
The six-step trace
- Did the definition change?
- Recompute on the old definition
- Did the population change?
- Does each subgroup's own rate hold?
- What else would the theory predict?
- What is left unexplained?
Recording the residual is the step people skip. Some of the movement was never explained, and the write-up said so. An account that explains everything is usually an account that stopped looking.
What was actually done
Two changes, neither of them the one that had been proposed at the start.
The stage definition was pinned and dated, with the previous version kept, so that any future comparison could be made on a consistent basis. The rule adopted was that a definition change gets recorded next to the metric it affects, and that the metric is reported with a marker at the point of change.
The channel was not shut off. It was reported separately, with its own conversion rate and its own cost. The decision to keep feeding it could then rest on its own terms, not a blended average.
That is a smaller intervention than the reorganization under discussion. It left the evidence in place to make the larger decision later.
The proposal that had been on the table, moving two people onto a different segment, was dropped. It would have been evaluated against a number that was about to move for unrelated reasons, which is how a change gets credited with an effect it did not have.
Why the first explanation is usually about people
Three patterns recur. An explanation that blames conditions cannot be checked, so it never loses. An explanation that blames capability resolves itself with time, so nobody has to act. An explanation that blames the measurement is unwelcome, because it implies the reporting was wrong, and someone owns the reporting.
The defense is procedural rather than personal. A theory offered before anything has been ruled out is a preference, not a finding. The same discipline applied to somebody else's published result, rather than your own, is in operations case studies.
Reading this case properly
Nothing here transfers as a conclusion. What transfers is the order of the checks and the habit of asking what else a proposed cause would predict.
The underlying trap is that any composite operational number can move without anything underneath it changing, which is a property of measurement rather than of sales, and the general treatment is in operating processes metrics.
The pipeline design questions this case touches, particularly what a stage is allowed to mean, are in business development ops. If a trace like this ends in an actual change to how the work is done, the sequencing of that is a separate discipline and sits in change management.
Structured cause analysis of this kind is used where the stakes are far higher than a sales pipeline. The method is in the root cause analysis primer from the US Agency for Healthcare Research and Quality.
Common questions
How long should a trace like this take?
A day for the first pass, and if it takes longer than a week you are building an analysis rather than answering a question. The value is in ruling things out quickly, not in a complete account.
What if the definition genuinely did not change?
Then you have ruled out the cheapest explanation and you move to population. The point of checking it first is not that it is usually the answer. It is that it takes an hour and everything else takes days.
Who should run it?
Someone who does not own the number. Not because of dishonesty, but because the person who built the report knows what they intended it to mean and will read past the thing that changed.
Is a residual you cannot explain acceptable to report?
Yes, and reporting it is what makes the rest credible. An unexplained remainder tells a reader where the account stops. A complete-looking explanation with no remainder invites them to trust parts of it that were never tested.