Features
Detroit lean operations compared with Chicago distribution process control
Operations process control in Detroit leans on takt and cycle time, while Chicago distribution runs on dock-to-stock and throughput metrics.
What to take away
- Operations process control in Detroit is built around takt time, cycle time and first-pass yield on automotive lines.
- Chicago distribution floors track dock-to-stock hours, lines per hour, inventory turns and fill rate instead.
- Both sectors cite the same federal scaffoldingNIST manufacturing programs, Baldrige criteria and BLS industry data.
- Takt and cycle time translate between the two cities; dock-to-stock does not have a clean automotive equivalent.
- A Detroit plant can borrow dock scheduling and slotting logic from Chicago without rewriting its line balance.
Detroit automotive lean practice: the metrics plants actually report
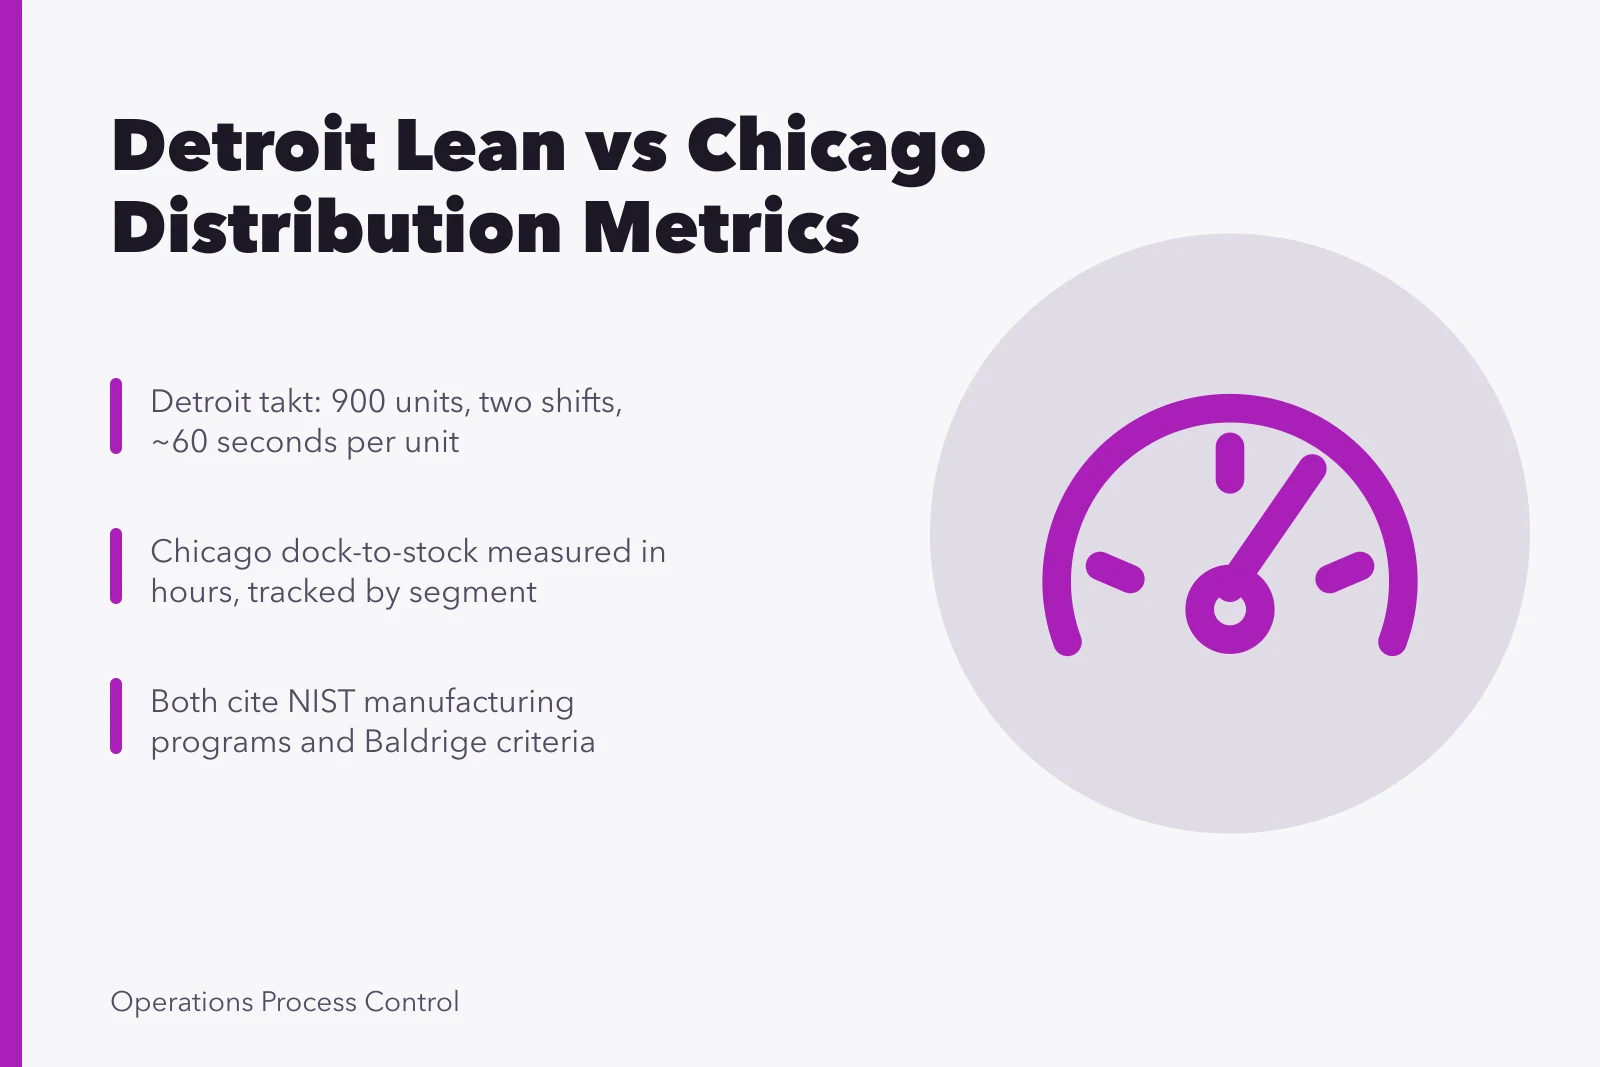
Detroit plants report a narrower metric set than outsiders expect. The core is takt time, the rate at which the line must complete one unit to meet customer demand. A Detroit plant running two shifts to build 900 units a day has a takt near 60 seconds per unit once breaks are netted out.
Takt vs Cycle Time
Takt time
- Definition
- Demand rate
- Example
- 60 sec per unit
- Problem
- Miss demand
- Fix
- Overtime, buffer
Cycle time
- Definition
- Station capability
- Example
- Station actual time
- Problem
- Exceeds takt
- Fix
- Second operator
Cycle time sits beside it. Where takt is demand, cycle time is capability: how long one station actually takes. When cycle time exceeds takt at any station, the line cannot hit demand without overtime, buffer or a second operator. Detroit managers watch that gap daily.
Then come the lean standbys: first-pass yield, overall equipment effectiveness, andon pull frequency, and overtime as a share of straight time. These are the numbers that appear in a Detroit plant's morning walk. They are also the numbers an operating processes framework has to accommodate before any dashboard gets built.
Automotive lean metrics in Detroit carry a second layer that distribution rarely sees. Changeover time, or SMED, matters because model mix changes within a shift. A Detroit plant building three variants on one line lives or dies on how fast the line converts.
Safety reporting runs alongside. Detroit and Chicago plants file through the same federal channels even though their metric boards share almost nothing else. Michigan managers keep the OSHA offices by state directory handy for inspection contacts and state plan questions. Lost-time rates sit on the same board as takt.
Chicago distribution control: throughput, dock and inventory measures
Chicago distribution control measures start at the dock. Dock-to-stock time is the interval from trailer arrival to inventory available to pick. A well-run Chicago DC measures it in hours, not days, and tracks receiving, putaway and system posting as separate segments.
Throughput follows. Managers report lines per hour, units per hour and cases per labor hour, usually split by shift and by zone. A single blended number hides the fact that a bulk zone and a piece-pick zone have nothing in common operationally.
Inventory measures round out the set: inventory turns, days of supply, cycle count accuracy and shrink. Fill rate and on-time shipment sit on the outbound side. Together these form the logistics control metrics a Chicago operation is judged on.
Capacity planning is the quiet constraint. Chicago's position as a rail and interstate hub means inbound volume arrives in waves, so dock scheduling and trailer yard control matter as much as pick productivity. A Chicago DC with idle doors and a full yard is losing money in plain sight.
Labor is the other variable. Chicago area warehouse wages and turnover move with the broader market, which is why managers pull BLS industry statistics when they build a staffing model or justify a wage adjustment.
Where the two sectors share process control discipline
Detroit and Chicago sit on the same freight corridor, and parts built in Detroit regularly move through Chicago warehouses and rail yards before reaching dealers. Strip the vocabulary and the underlying disciplines converge. Both sectors run standardized work, visual control, and a defined response when a process drifts.
That is where process mapping vs value stream mapping becomes a practical question rather than an academic one. A Detroit line usually needs the full value stream view because material flow crosses the plant. A Chicago pick module often needs only a process map of the order-to-ship path.
Both sectors also share a measurement trap. When a metric misses, the first explanation is usually the wrong one, and the usual blame versus the real cause distinction applies equally to a stalled line and a backed-up dock.
Layered process audits are common to both. A supervisor checks a standard at a station; a lead checks a dock process at the start of a shift. Neither sector gets lasting control from a monthly report.
Standards each side cites: NIST manufacturing programs and Baldrige criteria
Detroit leans harder on federal manufacturing support. NIST manufacturing programs cover measurement science, standards and extension work that automotive suppliers use when a customer demands traceable process data.
Chicago operations tend to cite the same body of work less often, though the Baldrige framework applies just as well to a distribution business. The Baldrige performance excellence criteria organize an operation around leadership, strategy, customer, measurement, workforce, operations and results.
Both sectors can reach citable technical standards through NIST publications. That matters when a customer audit asks for a documented method rather than a vendor claim.
A quality management framework underpins both. Detroit calls it APQP or PPAP; Chicago calls it a receiving inspection plan. The team management metrics lessons are the same: define the standard, verify it, and correct the process rather than the person.
Standards each side cites
Detroit automotive lean
- Primary rate metric
- Takt time per unit
- Capability metric
- Cycle time per station
- Flow metric
- WIP between stations
- Quality metric
- First-pass yield, defects per unit
- Change metric
- Changeover time
- Federal reference
- NIST manufacturing programs
Chicago distribution control
- Primary rate metric
- Lines or units per hour
- Capability metric
- Dock-to-stock hours
- Flow metric
- Inventory turns, days of supply
- Quality metric
- Cycle count accuracy, shrink
- Change metric
- Slotting and re-slot frequency
- Federal reference
- BLS industry data
Comparing takt, cycle time and dock-to-stock across the two cities
Detroit and Chicago ask different questions of their numbers. Takt and cycle time are demand and capability. Dock-to-stock is elapsed time. The three do not convert directly, which is why cross-sector comparisons fail when someone tries.
Worked Example: Detroit to Chicago
- 105 secTakt time per rack
- 130 secPackaging cycle time
- 40 trailersDaily Chicago DC receipts
- 4 hoursDock-to-stock target
A worked example shows the gap. Suppose a Detroit supplier must ship 480 racks a day to a Chicago DC across two shifts, with 420 productive minutes per shift. Takt is 840 minutes divided by 480 racks, about 105 seconds per rack.
If the packaging station takes 130 seconds, cycle time exceeds takt and the plant misses the schedule. The fix is a second station or a faster method, not more overtime.
Now the Chicago side. That DC receives 40 trailers a day and wants dock-to-stock under four hours. With 12 doors and a 10-hour receiving window, each door must turn a trailer roughly every three hours. If unloading averages two hours and putaway one, the door is oversubscribed and the yard backs up.
The lesson is that Detroit optimizes a rate and Chicago optimizes a queue. A rate metric tells you whether the line can keep up. A queue metric tells you whether the dock can absorb what arrives.
What a Detroit plant can borrow from a Chicago distribution floor
Detroit plants often treat inbound and outbound as a necessary evil. Chicago treats the dock as the operation. That mindset transfers cleanly.
What a Detroit plant can borrow
- Measure dock-to-stock on your own receipts, even if you call it something else. Start the clock at trailer arrival and stop it when material is available to the line.
- Slot by velocity. Fast-moving parts belong near the point of use, slow movers further out. Chicago DCs re-slot on a schedule; many Detroit plants never do.
- Schedule appointments against door capacity, not against carrier convenience. Door-hours are the constraint, not trailer count.
- Publish a yard and door board the way a Chicago DC does. Visual control at the dock prevents the phone calls that eat a shift.
- Track inventory accuracy at the location level. Cycle counting by location catches errors that a full physical inventory only finds once a year.
None of this requires abandoning takt. It adds a queue discipline to a rate discipline, and the two coexist without conflict.
Metrics that survive a cross-sector comparison
Some metrics travel between Detroit and Chicago. Others do not, and forcing them creates noise. The test is whether the metric describes a rate, a queue or a quality outcome.
Rate metrics travel well. Units per labor hour, first-pass yield and changeover time mean the same thing on a Detroit line and on a Chicago pick module. Queue metrics travel well too: dock-to-stock, order cycle time and backorder age all describe waiting.
What does not travel is context. A takt time of 105 seconds is meaningless in a Chicago DC that ships mixed pallets. A dock-to-stock target of four hours is meaningless on a Detroit line that consumes material continuously.
Pick a small set and hold it. Most operations can run on a handful of rate, queue and quality measures, reviewed daily at the point of work. The operating processes metrics worth tracking question is really a question about which few numbers change a decision.