Features
3 staffing patterns for Phoenix, Atlanta, and Dallas call centers
Capacity planning formula meets real labor markets: three call center staffing patterns for Phoenix, Atlanta, and Dallas, built on BLS wage data and local supply.
What to take away
- The three staffing patterns for Phoenix, Atlanta, and Dallas call centers rest on different local wage floors and different labor supply shapes.
- OEWS puts the national median wage for customer service representatives (SOC 43-4051) near $19.75 an hour, about $41,000 a year. Phoenix runs below it; Atlanta and Dallas sit close to it.
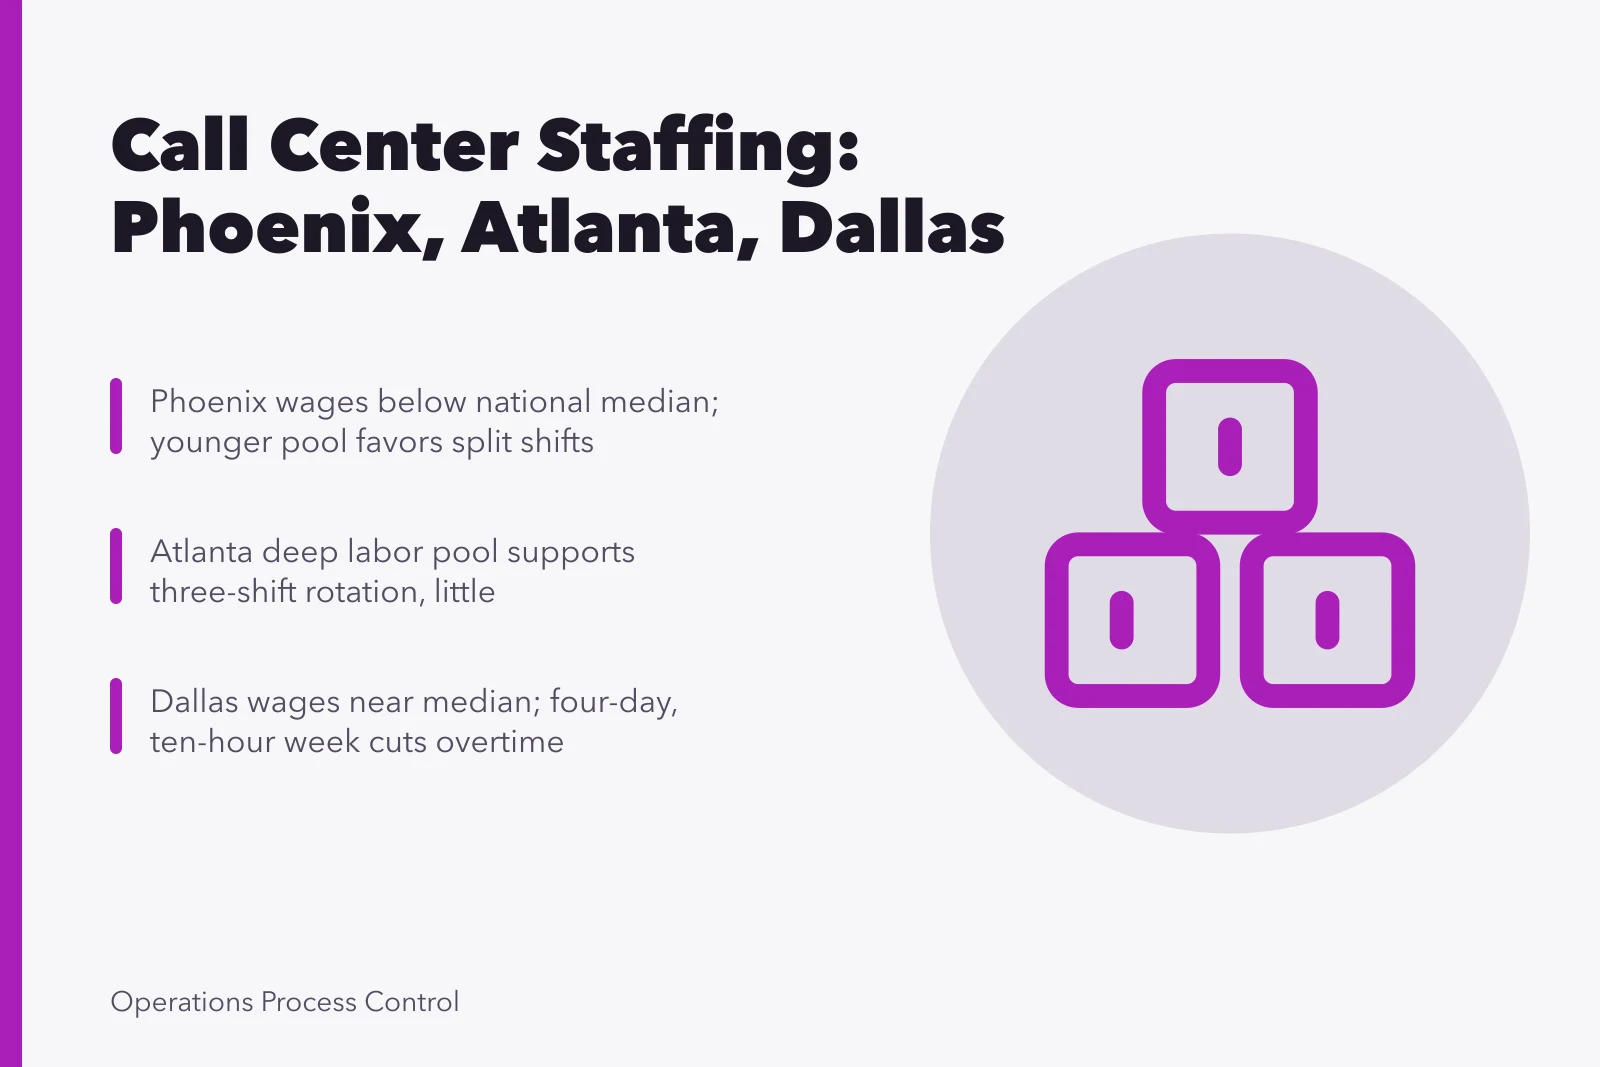
- Phoenix wage data supports a split shift pattern, with an evening differential of $1.00 to $2.00 an hour to fill 4 p.m. to 8 p.m. blocks.
- Atlanta labor supply is deep enough for a traditional three-shift rotation at 12% shrinkage with little overtime.
- Dallas wage data favors a compressed four-day, ten-hour schedule. A fifth day adds 10 overtime hours at 1.5 times base, about $293 per agent.
- Shift coverage comparison shows no pattern wins on both cost and coverage, so you pick the risk you can absorb.
Three staffing patterns and the local labor supply each assumes
A call center staffing pattern is a bet on who will show up, when, and at what price. Three patterns cover most U.S. metros, and each assumes a different labor supply shape.
Three Staffing Pattern Tradeoffs
Traditional
- Schedule
- Three 8-hour shifts
- Labor Assumption
- Deep labor pool
- Effective Hours
- 24-hour coverage
- Main Risk
- Turnover absorption
Split Shift
- Schedule
- Morning + evening blocks
- Labor Assumption
- Flexibility seekers
- Effective Hours
- 7.5 of 9-hour span
- Main Risk
- Coordination complexity
Compressed Week
- Schedule
- Four 10-hour days
- Labor Assumption
- Consecutive days off
- Effective Hours
- 38 before overtime
- Main Risk
- Worker fatigue
The traditional three-shift rotation runs three eight-hour shifts across 24 hours, with overlapping shifts at peak. It assumes a deep labor pool that absorbs turnover without a wage premium.
The split shift pattern pairs a morning block with an evening block after a long break. It suits metros where workers want flexibility and evening coverage is hard to fill. Plan on a differential of $1.00 to $2.00 an hour.
The compressed week runs four ten-hour days or three twelve-hour days. It assumes workers value consecutive days off more than daily convenience, and it trades fatigue risk for fewer shift changes.
Each pattern changes your capacity planning formula because each changes the effective hours per full-time equivalent. A split shift may yield 7.5 paid hours out of a 9-hour span. A compressed week may yield 38 hours before overtime.
Before you choose, list the inputs that actually predict staffing: arrival volume by half-hour, average handle time, shrinkage, and local wage floors. Then match the pattern to the labor supply you can actually hire.
Phoenix: wage data and the shift pattern it supports
Phoenix has grown fast in back-office and logistics work, and its call center labor market reflects that. OEWS puts customer service representative employment in the Phoenix-Mesa-Chandler metro in the 40,000 to 50,000 range, and the workforce skews younger, with a large share of hourly roles.
Phoenix Split Shift Planning Inputs
- 15%Shrinkage assumption
- 10%Evening differential
- 4-8 p.m.Peak coverage window
- 7.5 of 9Paid hours per split shift
According to Occupational Employment and Wage Statistics (OEWS) Tables : U.S. Bureau of Labor Statistics, customer service representatives in the Phoenix metro earn below the national median for the occupation, typically 3% to 7% under the national figure of about $19.75 an hour, or $41,000 a year.
That wage advantage is real, and it carries a catch: evening and weekend blocks are harder to fill without a differential.
Arizona's minimum wage is $15.15 an hour as of January 2026, which sets the floor for entry-level blocks. The Arizona Fair Wages and Healthy Families Act also requires paid sick time accrual for hourly staff.
Phoenix wage data supports the split shift pattern. You can hire a morning block and an evening block at a lower base rate than a straight eight-hour shift, because you are not asking for a full day. The split also covers the 4 p.m. to 8 p.m. peak without paying a full shift of overtime.
The risk is coordination. Split shifts need more supervisors per headcount and more complex schedules. If your team management metrics start with a test rather than a spreadsheet of numbers, you will catch the adherence problems early.
For Phoenix, run the capacity planning formula with a 15% shrinkage assumption and a 10% evening differential. On an $18.50 base rate that is $1.85 an hour, or a blended $20.35 before benefits. If the differential pushes the blended rate above the national median, the split shift loses its advantage.
Employers hiring against those numbers include JPMorgan Chase in Tempe, American Express, and Banner Health. Arizona@Work, the state workforce network, runs hiring events and posts wage data by occupation. Valley Metro light rail links Phoenix, Tempe, and Mesa, which widens the hiring radius for late blocks.
Atlanta: labor supply and the pattern that fits
Atlanta is a hub for call centers, logistics, and corporate operations. OEWS puts customer service representative employment for Atlanta-Sandy Springs-Roswell in the 45,000 to 55,000 range, with mean pay within about 2% of the national median.
Atlanta Traditional Rotation Inputs
- 12%Shrinkage assumption
- 8 a.m. to 5 p.m.East Coast shift
- 10 a.m. to 7 p.m.West Coast shift
- Near medianWage level
That depth changes the math. In Atlanta, you can staff a traditional three-shift rotation without paying much overtime, because the pool absorbs turnover. The trade-off is a base wage near the national median, so cost per hour runs above Phoenix.
Atlanta labor supply also supports a follow-the-sun model if you serve national customers. Run a standard 8 a.m. to 5 p.m. shift for East Coast customers and a 10 a.m. to 7 p.m. shift for West Coast coverage. MARTA rail reaches downtown, Midtown, and the airport, which helps late-shift recruiting.
The traditional rotation fits Atlanta because the labor pool is stable enough to plan around. You do not need split shifts to cover evenings; you can hire for them directly.
Use the operating processes metrics worth tracking to monitor schedule adherence and occupancy. In a deep labor market, the bigger risk is overstaffing from a conservative forecast.
Atlanta's capacity planning formula should use a lower shrinkage assumption, around 12%, because the labor pool is more reliable. That lower shrinkage directly reduces your required headcount.
Georgia Quick Start, run by the Technical College System of Georgia, covers customized training for qualifying new operations. Delta Air Lines, AT&T, Cox Enterprises, and The Home Depot run large support operations in the metro, so experienced applicants are easy to find. Georgia follows the federal $7.25 minimum wage and sets no state meal or rest break rule.
Dallas: wage data and the pattern that fits
Dallas-Fort Worth-Arlington holds more customer service representative jobs than either Phoenix or Atlanta. OEWS puts metro employment in the 60,000 to 75,000 range, with mean pay within a few percent of the national median, near $19.50 an hour.
Dallas Compressed Week Inputs
- 13%Shrinkage assumption
- 5%Fourth-day differential
- 4 x 10Schedule format
- Last 2 hoursQuality risk window
The metro has a high share of workers in logistics and back-office roles, and many commute from suburbs such as Plano, Frisco, and Arlington.
Dallas wage data supports the compressed week. A four-day, ten-hour schedule gives you three days of coverage per week with fewer shift changes, and it reduces overtime because you are not stretching an eight-hour shift.
A fifth day is where the cost shows up. Ten overtime hours at 1.5 times a $19.50 base rate run about $293 per agent, against $195 at straight time.
The compressed week also fits Dallas because fewer commutes per week is a real benefit, and it helps retention. DART light rail and the TRE serve parts of the metro, but coverage outside the core is thin.
The risk is fatigue. Ten-hour shifts on phones can degrade quality in the last two hours. You need to monitor average handle time and customer satisfaction by hour of shift.
For Dallas, run the capacity planning formula with a 13% shrinkage assumption and a 5% shift differential for the fourth day. If your quality metrics hold, the compressed week saves on overtime and supervision.
Dallas also has a strong base of bilingual workers, which matters if you serve Texas and national markets. A compressed week makes it easier to schedule bilingual coverage across four days rather than five.
AT&T, Southwest Airlines, Texas Health Resources, Capital One, and Fidelity Investments run large service operations in the metro. WorkInTexas.com, the Texas Workforce Commission job board, is where many of those roles get posted. Texas follows the federal minimum wage and leaves meal and rest breaks to federal rules.
Reading BLS occupational and geographic statistics for each city
BLS occupational statistics give you wage and employment numbers by occupation, which is the only defensible way to compare Phoenix, Atlanta, and Dallas. The Overview of BLS Statistics by Occupation : U.S. Bureau of Labor Statistics is the starting point.
BLS geographic statistics let you drill down to metropolitan areas. You can pull employment and wage data for Phoenix, Atlanta, and Dallas separately, rather than relying on state averages.
The Current Employment Statistics - CES (National) : U.S. Bureau of Labor Statistics gives you monthly employment levels by metro, which helps you spot labor market tightening before it hits your recruiting. If CES shows employment rising in your metro, expect wage pressure.
Use the Schedule of Selected Releases for September 2026 to time your data pulls. You want the most recent OEWS and CES releases before you set next quarter's staffing plan.
When you read the numbers, separate the occupation codes. Customer service representatives (43-4051) are not the same as telemarketers (41-9041) or medical secretaries (43-6013). Your capacity planning formula should use the code that matches your actual work.
OEWS publishes a relative standard error with each metro estimate. When the error is wide, treat the wage as a range rather than a point. Wage records from Arizona DES, the Georgia Department of Labor, and the Texas Workforce Commission give you a second check on local pay.
For city-level comparisons, use the Overview of BLS Statistics by Geography : U.S. Bureau of Labor Statistics to find the right metropolitan statistical area definitions. Phoenix, Atlanta, and Dallas are all large MSAs, but their boundaries matter for wage data.
Comparing the three patterns on cost and coverage
The table below compares the three patterns on the dimensions that matter most for staffing: cost, coverage, and risk. The rates are illustrative and should be replaced with your own wage and shrinkage data.
Pattern Cost and Coverage Comparison
Traditional
- Metro Fit
- Atlanta
- Cost Driver
- Base wage near median
- Coverage Strength
- Full 24-hour coverage
- Main Risk
- Overstaffing
Split Shift
- Metro Fit
- Phoenix
- Cost Driver
- Lower base, evening diff
- Coverage Strength
- Peak without overtime
- Main Risk
- Scheduling complexity
Compressed Week
- Metro Fit
- Dallas
- Cost Driver
- Overtime reduction
- Coverage Strength
- Fewer shift changes
- Main Risk
- Fatigue in later hours
Comparing the three patterns
Metro fit
- Traditional three-shift
- Atlanta, 45,000 to 55,000 customer service representatives
- Split shift
- Phoenix, 40,000 to 50,000 customer service representatives
- Compressed week
- Dallas, 60,000 to 75,000 customer service representatives
Cost driver
- Traditional three-shift
- Base wage within 2% of the $19.75 national median; night differential 10% to 15%
- Split shift
- $18.50 base plus a $1.85 evening differential at 10%
- Compressed week
- Overtime control; a fifth day costs 10 hours at 1.5 times base
Coverage strength
- Traditional three-shift
- Full 24-hour coverage
- Split shift
- Peak coverage from 4 p.m. to 8 p.m. without overtime
- Compressed week
- Fewer shift changes across four ten-hour days
Main risk
- Traditional three-shift
- Overstaffing if the forecast runs high
- Split shift
- Scheduling complexity, one supervisor per 10 to 12 agents
- Compressed week
- Fatigue in hours nine and ten
Comparing the three patterns
| Pattern and metro | Paid hours per shift | Blended rate before benefits | Cost per productive hour at 12% to 15% shrinkage |
|---|---|---|---|
| Split shift, Phoenix | 9-hour span, 7.5 productive | $20.35 | about $29.90 |
| Three-shift rotation, Atlanta | 8 | $19.75 | about $28.10 |
| Compressed week, Dallas | 10, 38 productive per week | $19.50 base plus a 5% day-four differential | about $28.20 |
A shift coverage comparison shows that no pattern wins on both cost and coverage. The traditional rotation gives the best coverage but the highest base cost in Atlanta. The split shift gives the lowest base rate in Phoenix but the highest scheduling complexity. The compressed week gives the best overtime control in Dallas and adds fatigue risk.
Cost per productive hour narrows the wage gap. Phoenix's $18.50 base is the lowest of the three, yet 15% shrinkage plus a 10% differential brings its cost per productive hour to about $29.90, close to Atlanta and Dallas.
Supervision closes the gap further. A split shift often runs one supervisor per 10 agents against one per 15 on a standard rotation. Five extra supervisors at roughly $72,000 fully loaded cost about $360,000 a year per 150 agents, or $1.15 per agent hour.
Your capacity planning formula should output required headcount by interval, then you map that to the pattern. A sharp peak fits the split shift, which covers it with less overtime. A flat forecast fits the traditional rotation.
Use the Provincial Employment Standards for Shift Scheduling as a contrast if you operate in Canada, but do not copy those rules into U.S. metros. U.S. scheduling rules are mostly federal and state, not provincial.
Choosing a pattern when the forecast changes mid-quarter
Mid-quarter forecast changes are normal. The question is how quickly you can shift the pattern without breaking your labor agreements or your budget.
Mid-Quarter Pattern Change Checklist
- Re-run formula; >10% headcount change triggers review
- Check local labor supply for fastest lever
- Model supervision, fatigue, and overtime costs
- Review Arizona, Georgia, Texas break rules
- Communicate change with clear effective date
When you pick a pattern, use the naming the failure first approach: ask what would make this pattern fail in your metro, then design the schedule to avoid that failure.
For Phoenix, the failure is evening no-shows. For Atlanta, it is overstaffing. For Dallas, it is a quality drop in the tenth hour. Each failure points to a different control metric.
Keep a worked example. If your Dallas center needs 120 agents at peak and a compressed week yields 38 productive hours per agent, divide 120 by 38, round up, then gross up for 13% shrinkage.