Guides
Capacity Planning Formula for Call Centers: The Inputs That Actually Predict Staffing
Capacity planning formula for call centers: which Erlang C inputs to trust, the service level thresholds that trigger a rebuild, and what the model cannot see.
What to take away
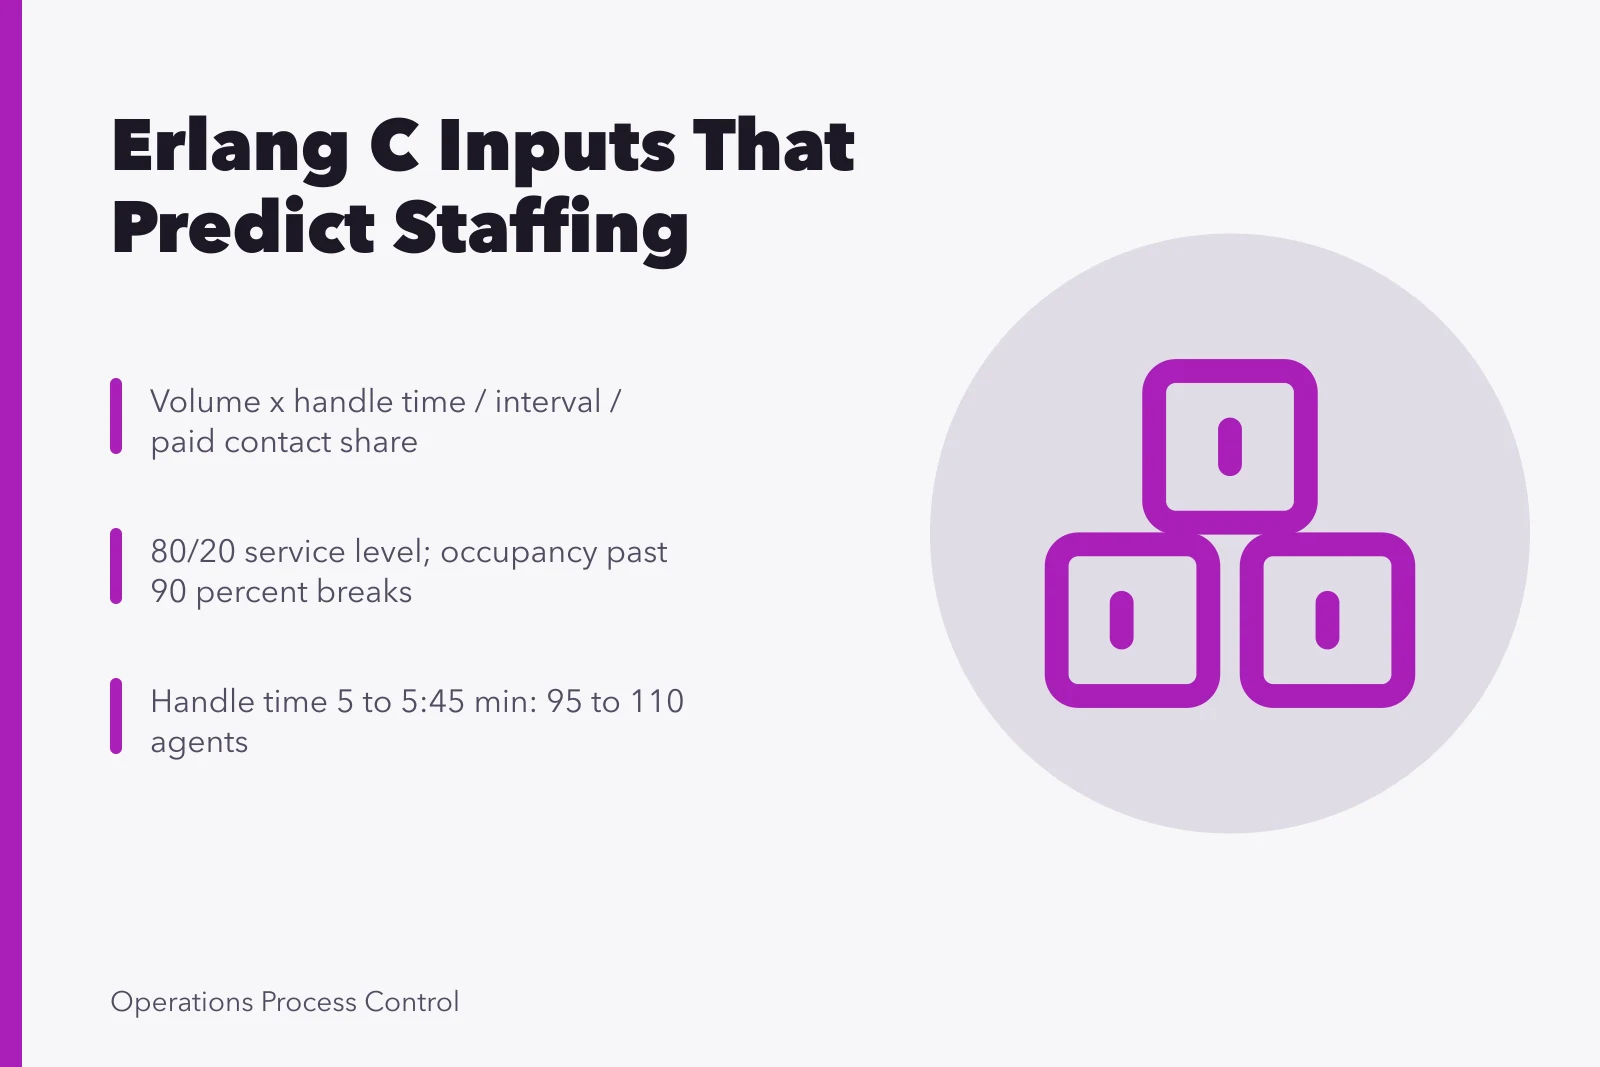
- The capacity planning formula for call centers is contact volume times average handle time, divided by the interval length, then divided by the share of paid time agents spend on contacts.
- Erlang C turns that workload into a headcount for a stated service level, such as 80 percent answered within 20 seconds.
- Shrinkage and average handle time carry more error than the arrival model does.
- When service level misses target by 10 points or more in three consecutive intervals, the plan is wrong.
Inputs the Erlang C staffing calculator reads
The arithmetic is short. Everything hard sits in the inputs.
Erlang C Inputs and Ranges
- 4–9 minAverage handle time
- 25–40%Shrinkage
- 80/20Service level target
- 2–4×Peak interval volume vs daily average
Average handle time is talk time plus hold time plus after-call work, averaged across completed contacts in one interval. Shrinkage is paid minutes that cannot take contacts, divided by total paid minutes, covering breaks, training and absence.
Contact volume must arrive per interval, not per day. A daily total of 3,000 contacts hides the 9 a.m. peak that decides the roster. Most US sites plan in 15 or 30 minute blocks. The management foundations checks behind that setup are mundane: fix the interval length, fix the contact definition, and hold both across sites.
| Input | Definition | Illustrative US range |
|---|---|---|
| Average handle time | Talk, hold and after-call work per completed contact | 4 to 9 minutes |
| Shrinkage | Paid minutes unavailable for contacts, divided by paid minutes | 25% to 40% |
| Service level target | Share of contacts answered inside a time threshold | 80/20 in many retail and telecom queues |
| Interval volume | Contacts offered in each 15 or 30 minute block | Often 2 to 4 times the daily average at peak |
| Occupancy | Workload hours divided by staffed hours | 80% to 90% |
Little's Law is the quick check: the number of contacts in the system equals the arrival rate multiplied by the time each spends there. If the model says 40 are waiting and the screen shows 12, the arrival rate is wrong.
Reading a staffing number against a service level target
Service level is the share of contacts answered inside a threshold, written as a pair such as 80/20. That means 80 percent answered within 20 seconds.
US retail, telecom and healthcare support teams use similar pairs, though a billing queue and a nurse line should not share one number. Team management metrics matter at this point, because a schedule nobody checks adherence against is only a wish.
Occupancy is workload hours divided by staffed hours. Past 90 percent, agents lose the room to finish after-call work, so handle time climbs.
Service level at 80/20 costs less on a quiet Tuesday than on a Monday peak. Quote the interval, never the month.
Example: a 15 percent move in average handle time
An interval from 9:00 to 9:30 offers 400 contacts, an illustrative figure.
At an average handle time of 5 minutes, the queue needs 2,000 minutes of talk and after-call work, or 33 hours. Over half an hour that is roughly 67 agents, or about 95 once 30 percent shrinkage is added.
Raise average handle time to 5 minutes 45 seconds and the same 400 contacts need about 110 agents.
What the formula cannot tell you
Erlang C assumes contacts arrive at random, wait in one queue and never abandon. Real queues abandon, retry, get transferred and split across skills, none of which the model holds.
Service level has a blind spot of its own. It counts answered contacts against a clock and ignores what happened after the answer, so a queue fast on easy calls can look healthy while satisfaction falls.
Shrinkage is usually held as one daily average even though it varies by hour.
Attribution and its limits
An IVR change, a price move, an outage and a hiring freeze can land in the same week. Recency bias pushes managers toward whatever happened last. A sceptical read of change management helps when a team credits a new process for a gain a campaign produced.
Keep a dated log of every change to the queue, or nobody can tell a staffing shortfall from a demand shift. For labor assumptions, the Occupational Outlook Handbook entry on customer service representatives is a first stop.
When to stop measuring and decide
Act on these thresholds instead of watching the dashboard:
When to Act on Staffing
Service level 10+ points below target for three intervals?
Add staff or reset the target
Continue monitoring
Stop once the interval pattern repeats for two weeks. More data past that point buys confidence you already hold, and the cost is a schedule published late. What the interval record needs when it is challenged is set out in the performance management case study.